True, GTID is upon us whether via MySQL 5.6 or Tungsten Replicator (and wasn’t it in Google Patches since 2009?).
But some of us are still using standard replication with MySQL 5.5, and the “what’s with all these binary log files and positions” question is ever erupting. The output of SHOW SLAVE STATUS confuses people new to it. It confuses me time and again.
So here’s the semi visual guide to interpreting the SHOW SLAVE STATUS.
About binary logs and relay logs
A master writes binary logs. These are typically and conventionally called mysql-bin.##### or mysqld-bin.##### (replace ##### with digits).
A slave connects to its master, and reads entries from the master’s binary logs. The slave writes those entries into its own relay logs. These are typically and conventionally called mysql-relay.##### or mysqld-relay.##### (replace ##### with digits).
There is nothing at all that connects the name or number of a slave’s relay log with the master’s binary log. There is nothing at all that connects the position within the relay log with the position within the master binary log. Files are flushed/rotated; have different size configuration; are re-created. However the slave does keep track on the current relay-log entry: it knows what’s the matching entry on the master’s binary logs. This is an important piece of information.
While the slave fetches entries and writes them into the relay log (via the IO_THREAD), it also reads the relay log to replay those entries (via the SQL_THREAD).
And so at each point in time we are interested in the following “coordinates”:
- What are we fetching from the master? Which file are we fetching and from which position?
- Where are we writing this to? (This is implicitly the latest relay log file and its size)
- What’s the position of currently executing slave query, in relay-log coordinates? As the slave lags these coordinates are farther (smaller) than the written-to position.
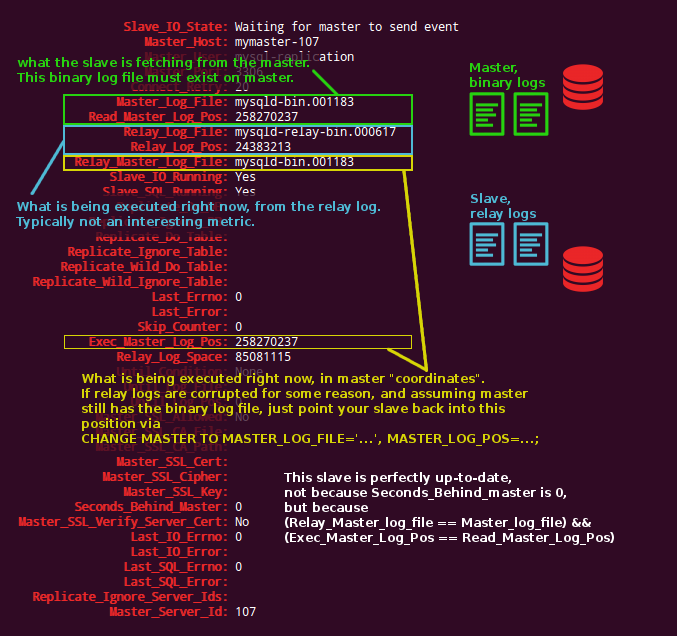
- What’s the position of currently executing slave query, in master binary-log coordinates? This information really tells us how far apart we are from the master.
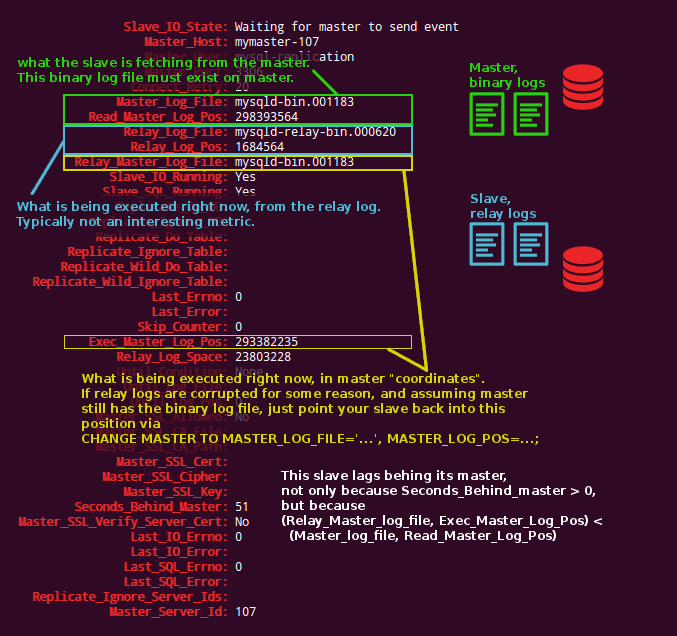
How do we interpret the above from SHOW SLAVE STATUS output? Take the following two images as guidelines. The first presents an up-to-date slave, the second presents a lagging slave.
Hopefully this “once and for all” explanation will last a couple weeks.
The error log would mention the master log file and position when the slave stops. Is it “Master Log File” or “Relay Master log file” that is shown in the error log?
Both!
Here’s a sample:
The first entry is the SQL thread, talking about the execution position and the matching relay log position.
The second is the I/O thread, which notes the position that is being fetched.
very helpful. good explanation of 6 parameters and mainly of relay_master_log_file and exec_master_log_pos.
thanks.
Good explaination graph!
Thanks for clever explanation