Rev. 57 of mycheckpoint has been released and is available for download.
New and updated in this revision:
Remote host monitoring
It is now possible to monitor one host, while writing into another. Either or both could be remote hosts:
mycheckpoint --host=localhost --monitored-host=192.168.10.178
The above monitors the MySQL server on 192.168.10.178, and writes down to localhost (to be queried later)
mycheckpoint --monitored-host=127.0.0.1 --host=192.168.10.178
The above monitors the MySQL server on 127.0.0.1, and writes down to 192.168.10.178.
As result of the above addition, binary logging for monitoring statements are now enabled by default. The previous solution, in which binary logging were disabled by default and the same schema was utilized by different servers was far from being a clean solution. [Read more on Remote & multiple hosts monitoring]
Improved charting
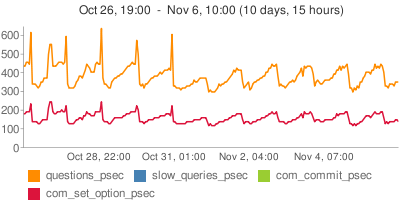
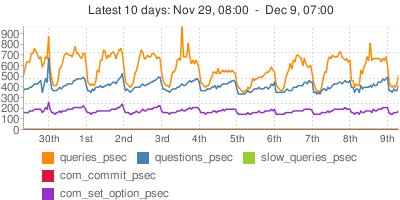
The google charts reports have been improved significantly. Here’s how:
Before on left (or above), After on right (or below)
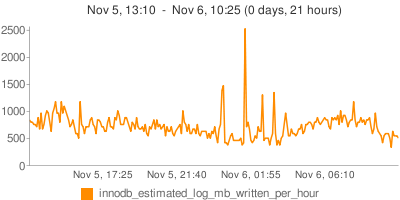
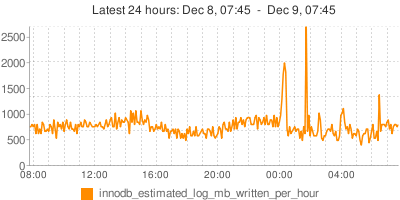
And
Before on left (or above), After on right (or below)
Recap: the charts are not stored anywhere; they are being calculated and generated by SQL queries & views, based on the raw data. For example, to generate the above, I do:
SELECT innodb_estimated_log_mb_written_per_hour FROM sv_report_chart_sample\G
*************************** 1. row ***************************
innodb_estimated_log_mb_written_per_hour: http://chart.apis.google.com/chart?cht=lc&chs=400x200&chts=303030,12&chtt=Latest+24+hours:+Dec+8,+08:20++-++Dec+9,+08:20&chdl=innodb_estimated_log_mb_written_per_hour&chdlp=b&chco=ff8c00&chd=s:OQOTSPPQPSROUQMTRSQTPSURQTQQPSOSRTRRUTRRTSRRRSRSTRRQSURSUVRRXQTVRUTTVUTOYTXSYTTSYUSUTWUPRRPQSQRQTPPSPQMPPQOQMQPMOMOLQORNNPNRNNOPQOOMQQPNRNMNORQMSTQQPTPRUQVQTTVSURUVVVSSSVWQVUSTVSWSSUURWRVRTWdotpQNROPQRPQQMPLRO9PWNRPNNNPXUMLNNPQQPSONPLLNWXZTQROSQMOONQPLJNOOQQKMPSMMPLfPSSSRTUQSORSSRSPNRSQSQ&chxt=x,y&chxr=1,0,2708.0&chxl=0:|09:00||||13:00||||17:00||||21:00||||01:00||||05:00||||&chxs=0,505050,10&chg=4.17,25,1,3,2.78,0&chxp=0,2.78,6.95,11.12,15.29,19.46,23.63,27.80,31.97,36.14,40.31,44.48,48.65,52.82,56.99,61.16,65.33,69.50,73.67,77.84,82.01,86.18,90.35,94.52,98.69
If you thought I was going over the edge in Auto scaling, scaled SQL graphs concluded or SQL pie chart, allow me to assure you: generation of the above charts using SQL & views is SQL blasphemy. While cool, the Google Charts API does not do too much on its own, and expects the caller to do the math for putting in the grids, scales and labels (and though all of them are tightly related, they must all be explicitly specified). I’ll write a later post on this.
Flexible charting
A new table, called charts_api, is introduced. It contains one row, which lists charting configuration.
SELECT * FROM charts_api;
+-------------+--------------+----------------------------------------------------------------+------------------------------------+
| chart_width | chart_height | simple_encoding                                                | service_url                        |
+-------------+--------------+----------------------------------------------------------------+------------------------------------+
|         400 |          200 | ABCDEFGHIJKLMNOPQRSTUVWXYZabcdefghijklmnopqrstuvwxyz0123456789 | http://chart.apis.google.com/chart |
+-------------+--------------+----------------------------------------------------------------+------------------------------------+
To change generated charts dimensions, simply update chart_width or chart_height.
To use other chart APIs, update service_url. I’ve tried out Eastwood Charts, a Java-based service, which implements the Google Charts API. There’s still some stuff missing, such as the positioning of labels and grids; and it’s slightly less polished (but configurable). But if you’re concerned about sending requests to Google, it’s a viable alternative.
So, drop the WAR file into your Tomcat / JBoss / other j2ee server, then follow http://127.0.0.1/eastwood/chart?…
Fix to questions vs. queries issues
mycheckpoint now correctly identifies whether to use questions or queries when analyzing DML queries. If you got some 570% for com_update out of total queries and wondered about it, it should now be resolved to normal values.
On upgrading your current installation
- Download & install via debian or python installers
- Issue mycheckpoint once with “deploy” as argument
- Done
Future plans
I’m working on 24×7 charting; minimal operating system monitoring; auto-detection and auto-deploy on version upgrade; and more.
Stay tuned!


One thought on “New and noteworthy in mycheckpoint (rev. 57)”