Revision #88 of mycheckpoint is released. In this revision:
- Disk space monitoring
- Improved charting
- Enhanced auto-deploy
- And more…
Disk space monitoring
mycheckpoint now monitors (on Linux only) three mount points:
- The “/” (root) mount point
- The datadir mount point
- The tmpdir mount point
It may well be the case that two of the above (or perhaps all three of them) share the same mount point. For example, if there isn’t any particular partition for “/tmp“, it is possible that the tmpdir (by default “/tmp“) is on the same mount point as “/“. mycheckpoint does not care.
mycheckpoint monitors and reports the mount point’s used percent, in a similar algorithm df uses.
Disk space monitoring is only possible when monitoring the local machine (i.e. mycheckpoint runs on the same machine as the monitored MySQL server). In the future mycheckpoint may also monitor additional mount points, such as the various logs mount points.
Improved charting
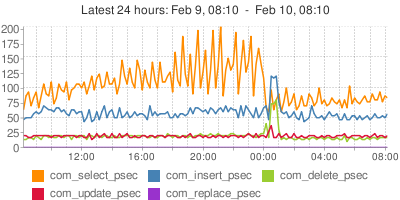
There has been some extensive work to turn the charts into real time-series based. Google charts does not support time series charts; when it will, the required URL length would probably be too long to be used. Some SQL tweaks made it possible to display the charts in correct time-scale even if sampling is taken on non constant interval (or fail to be taken for long periods).
For more examples see the link for HTML brief reports sample, below.
I will write more on SQL Google charts generation in the future.
Enhanced auto-deploy
mycheckpoint will now detect changes to the MySQL version, in addition to changes in mycheckpoint‘s version itself. This means there’s no need in ever worrying about upgrades to either one of these components. Just use mycheckpoint to take another sample; it will auto-detect if the MySQL version is different, and start sampling all those new variables introduced in the new version (or stop sampling variables no longer used). It works both for MySQL upgrades and downgrades.
Enhanced localhost detection
To determine whether it is monitoring the local host, mycheckpoint now considers the hostname for the monitored server, and sees if it is either ‘127.0.0.1’, ‘localhost’, or the machine’s hostname or fully qualified hostname.domainname (these last two additions apply for Unix based machines, and have only been tested on Linux so far).
HTML brief reports
Getting a full HTML report is time consuming. I’ve had requests (though not officially submitted through the Issues mechanism) to make it shorter. This is as yet a difficult job. There’s just too much data to aggregate (up to ~180 days of every-5-minute-samples, in a common scenario).
HTML brief reports were introduced in previous versions, and have now been enhanced to include more data. These only present last 24 hours data, and load fast. See HTML brief report sample.
Get it
Downloads are available on Google code’s mycheckpoint page. Documentation can be found on the mycheckpoint home page.
On the press
Not so new by now (it’s two months old), I’m very happy that mycheckpoint has been noted by Jeremy Zawodny in his “My Top Resources of 2009” column on Linux Magazine.
Future plans
Immediate plans for mycheckpoint are:
- Email alerts notifications; this will allow mycheckpoint to become a real monitoring solution. Following the concept of “SQL oritented monitoring“, these will be SQL based as well.
- Custom monitoring: allowing user defined queries to be recorded by mycheckpoint; these can then participate in alerts monitoring. This will allow for easy email notifications on program-level errors.
