From Percona Server to MySQL and back to Percona Server: beware of crash safe replication info

We’re migrating some of our “vanilla” MySQL 5.5 servers to Percona Server 5.5. One of the major incentives is the crash-safe replication feature, allowing slaves to die (power failure) and resume replication without losing position in relay logs.

Whether or not we will migrate all our servers depends on further benchmarking; so far we’ve noticed unexpected results, but these are still premature to publish.

However the fact that we are using both MySQL & Percona Server has led us into a peculiar situation which I’d like to share. We reseed our servers via LVM snapshots. If we need a new machine, or have a corrupted slave, we capture an image of a running slave and duplicate it, a process which takes the better part of a day. This duplicates not only the data, of course, but also the relay logs, the relay-log.info file, master.info file, implying the position within the topology.

With crash safe replication this also means the transactional relay log position. Recap: crash safe replication writes, per transaction, the relay log status into ibdata1 file. So the relay log info in ibdata1 is in perfect alignment with your committed transactions. Upon server startup, Percona Server reads the info from ibdata1 and overwrites relay-log.info file (it completely disregards whatever was in that file prior to startup).

Can you guess what could get wrong here? Here’s the scenario we had; the same problem can unfold in different scenarios.

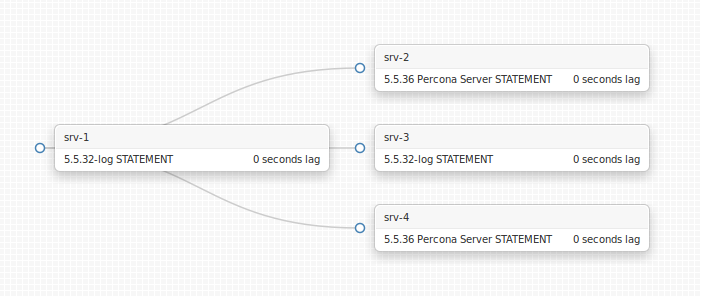
Take a look at the following topology:

simple topology

(this image is an actual online visualization of a replication topology; for purposes of this blog it’s a sandbox topology on my laptop. Please stand by for some very cool open source release announcement shortly)
Continue reading » “From Percona Server to MySQL and back to Percona Server: beware of crash safe replication info”

When you cannot replicate from master M to slave S

Working on some replication topology automation, here are some rules that will prevent you from replicating from a MySQL server M to a slave S:

  • M does not have binary logs (log_bin) enabled
  • M is itself a slave and does not have log_slave_updates enabled
  • M has a higher major version than S (e.g. M is 5.6 and S is 5.5, but do note log_bin_use_v1_row_events)
  • Both servers have same server_id
  • S has log_bin & log_slave_updates, uses STATEMENT binlog_format, and M uses ROW or MIXED binlog_format
  • S has log_bin & log_slave_updates, uses MIXED binlog_format, and M uses ROW binlog_format
  • S and M are using different replication filters (some rules could work; good luck if you’re that adventurous)

[EDIT: the above is configuration-wise]

Did I miss anything? Please comment below.

The mystery of MySQL 5.6 excessive buffer pool flushing

I’m experimenting with upgrading to MySQL 5.6 and am experiencing an unexplained increase in disk I/O utilization. After discussing this with several people I’m publishing in the hope that someone has an enlightenment on this.

We have a few dozens servers in a normal replication topology. On this particular replication topology we’ve already evaluated that STATEMENT based replication is faster than ROW based replication, and so we use SBR. We have two different workloads on our slaves, applied by two different HAProxy groups, on three different data centres. Hardware-wise, servers of two groups use either Virident SSD cards or normal SAS spindle disks.

Our servers are I/O bound. A common query used by both workloads looks up data that does not necessarily have a hotspot, and is very large in volume. DML is low, and we only have a few hundred statements per second executed on master (and propagated through replication).

We have upgraded 6 servers from all datacenters to 5.6, both on SSD and spindle disks, and are experiencing the following phenomena: Continue reading » “The mystery of MySQL 5.6 excessive buffer pool flushing”

Monitoring DML/slow queries with graphite

pt-query-digest, Anemometer or “Anemomaster” do a great job of analysing your queries and giving you visibility into what’s going on with your MySQL servers. However, the place where the query digests are written is just some MySQL tables on some server. Do you have monitoring/alerts on that table? How will you verify a specific query does not exceed some runtime/execution count threshold, and get notified when it does?

At Outbrain we use Graphite to collect almost all of our data. We like it for its simplicity and for the fact it has a “push” strategy as opposed to “pull” strategy: every service/server/collectd writes (pushes) its own data to Graphite, as opposed to having some centralized monitoring service trying to pull data from thousands of servers & services. We also have a great Graphite dashboard (developed at our company by Erez Mazor) called graphitus, which is a very sophisticated and easily configurable visualization solution (see documentation).

Our love/hate relationship with Nagios boil down to having a single Nagios plugin: one that reads data from Graphite. We use Nagios to generate our alerts, and dream of the day we will substitute it with something else (there’s not too much love in this love/hate relationship).

Graphite is a numeric timeseries data monitoring solution. How do you throw MySQL query analysis into Graphite, then?

The answer lies within the flexible structure of a Graphite metric entry, which is a freely composed path, such as collectd.hosts.us-east.myhost01.mysql.gauge-Threads_running.value. Graphite does not require you to pre-define paths, and you can use anything that makes sense to you. Thus, you can use a slow query’s text, for example, as part of the Graphite entry path. This is not entirely simple as the graphite path limits the allowed characters. So this is what we do: Continue reading » “Monitoring DML/slow queries with graphite”

“Anemomaster”: DML visibility. Your must-do for tomorrow

Here’s our take of master DML query monitoring at Outbrain (presented April 2014). It took a half-day to code, implement, automate and deploy, and within the first hour of work we managed to catch multiple ill-doing services and scripts. You might want to try this out for yourself.

What’s this about?

What queries do you monitor on your MySQL servers? Many don’t monitor queries at all, and only look up slow queries on occasion, using pt-query-digest. Some monitor slow queries, where Anemometer (relying on pt-query-digest) is a very good tool. To the extreme, some monitor TCP traffic on all MySQL servers — good for you! In between, there’s a particular type of queries that are of special interest: DML (INSERT/UPDATE/DELETE) queries issued against the master.

They are of particular interest because they are only issued once against the master, yet propagate through replication topology to execute on all slaves. These queries have a direct impact on your slave lag and on your overall replication capacity. I suggest you should be familiar with your DMLs just as you are with your slow queries.

In particular, we had multiple occasions in the past where all or most slaves started lagging. Frantically we would go to our metrics; yes! We would see a spike in com_insert. Someone (some service) was obviously generating more INSERTs than usual, at a high rate that the slaves could not keep up with. But, which INSERT was that? Blindly, we would look at the binary logs. Well, erm, what are we looking for, exactly?

Two such occasions convinced us that there should be a solution, but it took some time till it hit us. We were already using Anemometer for monitoring our slow logs. We can do the same for monitoring our binary logs. Thus was born “Anemomaster”.

Quick recap on how Anemometer works: you issue pt-query-digest on your slow logs on all MySQL hosts (we actually first ship the slow logs to a central place where we analyse them; same thing). This is done periodically, and slow logs are then rotated. You throw the output of pt-query-digest to a central database (this is built in with pt-query-digest; it doesn’t necessarily produce human readable reports). Anemometer would read this central database and visualize the slow queries.

Analysing DMLs

But then, pt-query-digest doesn’t only parse slow logs. It can parse binary logs. Instead of asking for total query time, we ask for query count, and on we go to establish the same mechanism, using same pt-query-digest and same Anemometer to store and visualize the DMLs issued on our masters.

When analysing DMLs we’re interested in parsing binary logs — and it makes no sense to do the same on all slaves. All slaves just have same copy of binlog entries as the master produces. It only takes one server to get an accurate picture of the DMLs on your replication topology.

Continue reading » ““Anemomaster”: DML visibility. Your must-do for tomorrow”

Some anecdotes I learned at Percona Live

While on the plane back home I wrote down all my impressions from Percona Live 2014. Have lots of TODOs and great ideas to implement. Among all my impressions, there were a few anecdotes worth noting.

  • 5.6 GTID is still unfriendly. It will require complete shutdown & reconfiguration of your entire replication topology; and some companies present hacks around this. Notable, Facebook recoded GTID related code (slave agrees to replicate with GTID even though its master still uses binlog coordinates). Booking.com have their own hack around slowly migrating their topologies. And in a great lightning talk we were shown how to patch MySQL such that the relay logs turn into a  consistent GTID-like coordinate system.
  • Galera replication has been implemented for TokuDB (only active-passive mode, not active-active). This came as a surprise to Tokutek ; apparently Codership did this within a few hours of work. The rest is up for Tokutek!
  • WebScaleSQL is a cool initiative that aims to assist in pushing commonly desired featured back upstream. It is Web Scale. It is also not a productio0n distribution and I do not expect it to be, It is not a fork that is meant for the common DBA to download and deploy.
  • Tungsten replicator has MySQL to Hadoop replication using staging tables – an auditing of changes that are group-deployed on Hadoop.
  • Still so many people unfamiliar with MySQLSandbox. It’s such a basic tool, especially for testing and local installations.
  • Still misconceptions about common_schema. Yes, I do use it on production.
  • Everyone has the same problems 🙂
  • Replication is still queen of MySQL’s featureset. We’re still all about failing over, promoting, scaling via replication.
  • Linux rules. Where two MacBooks failed to connect to the projector, my Lenovo/Ubuntu Linux did the job just fine and saved the day.

MySQL Community Awards 2014: the Winners

The MySQL Community Awards initiative is an effort to acknowledge and thank individuals and corporates for their contributions to the MySQL ecosystem. It is a from-the-community, by-the-community and for-the-community effort. The committee is composed of an independent group of community members of different orientation and opinion, themselves past winners or known contributors to the community.

The 2014 community awards were presented on April 3rd, 2014, during the community event at the Percona Live conference. The winners are:

MySQL Community Awards: Community Contributor of the year 2014

  • Colin Charles
    Colin’s list of service to the MySQL Community goes back almost 10 years. He was a community engineer starting in 2005, chaired some of the O’Reilly MySQL conferences, ran the MySQL projects for Google Summer of Code. As a partner and Chief Evangelist for Monty program, he continues to promote and grow the MySQL ecosystem. Though it’s his job, he goes above and beyond, driven by his passion for open source and MySQL.
  • Frédéric Descamps
    Frederic organizes the MySQL & Friends Devroom at FOSDEM every year. He worked towards making a true community driven event participated by all key players. in 2014 the MySQL & Friends devroom also presented a shared booth/stand regrouping Oracle, MariaDB/SkySQL and Percona engineers and developers.
  • Geoffrey Anderson
    Geoffrey is organizor & moderator at DBHangops: a bi-weekly community hangout discussing all things MySQL. The hangouts are free to join, and are streamed live and stored for later playback via YouTube.
    Geoffrey works to provide with content, and leads the hangouts with good spirit. DBHangOps makes for a good knowledge sharing media.

MySQL Community Awards: Application of the year 2014

  • Galera
    Galera provides MySQL with synchronous replication, offering a long time sought for High Availability solution for MySQL. It is fast becoming one of the main product/technology everyone is building next-gen businesses around. It is an important part of the renaissance of what’s next for the “ecosystem”.
  • Random Query Generator
    Random Query Generator has found hundreds of problems with its random generation of queries, because often the most serious bugs are outside of developers’ expectations and their test cases. Engineers who work on MySQL and its derivatives have been able to vastly improve the quality of the database because of it. Random Query Generator has positively effected every single user in the MySQL ecosystem, mostly without them even knowing it.
    RQG was originally created by Philip Stoev, and has attracted further contributors over the years.

MySQL Community Awards: Corporate Contributor of the year 2014

  • Oracle
    Oracle has continued to show its commitment to MySQL with the 5.6 release and work in progress on 5.7. MySQL 5.6 might be the best release ever with significant improvements for InnoDB and replication (performance, GTIDs, parallel apply) including significant changes from the community. The 5.7 release has equally high goals for making replication better (enhanced semi-sync) and making InnoDB faster on big multi-core servers. We also appreciate the continued involvement, excellence and passion of the support and community teams.
  • BinLogic
    BinLogic has been a great steward of the MySQL Community in one of the fastest growing technology hubs, Latin America. BinLogic created the MySQL, NoSQL and Cloud Solutions day in 2012 and repeated the event in 2013, drawing in notable speakers from the community.

Continue reading » “MySQL Community Awards 2014: the Winners”

Introducing Propagator: multi-everything deployment made easy

I’m happy to release Outbrain’s Propagator as open source. Propagator is a schema & data deployment tool which makes it easy to deploy, review, audit & fix deployments to your database servers.

What does multi-everything mean? It is:

  • Multi-server: push your schema & data changes to multiple instances in parallel
  • Multi-role: different servers have different schemas
  • Multi-environment: recognizes the differences between development, QA, build & production servers
  • Multi-technology: supports MySQL, Hive (Cassandra on the TODO list)
  • Multi-user: allows users authenticated and audited access
  • Multi-planetary: TODO

With dozens of database servers in our company (and these are master database servers), from development machines to testing machines, through build machines to production servers, and with a growing team of over 70 engineers, we faced the growing problem of controlling our database schema evolution. Controlling creation of tables, columns, keys, foreign keys; controlling creation of data that must be consistent across all servers became an infeasible task. Some changes were lost; some servers forgotten along the way, and inconsistencies blocked our development & deployments again and again.

We have reviewed schema-versioning tools (e.g. FlywayDB and Liquibase) only to conclude they solve a fraction of the problem. We looked at some GUI tools that promise to deliver the solution, but frankly any Windows Desktop GUI application is by definition the wrong tool for the job, and not (only) because of the “Windows” part.

Not all deployments are the same. Not all servers are the same. You don’t ALTER a big table on production. You may be using different schema names on different servers. You may have multiple schemas on a single server with identical structure. You may wish to only deploy to some development servers, possibly to a test server, but not to all, and yet be able to pick up on where you left a few days later on to complete your deployment. Some deployments fail, and for various reasons (e.g. John created that table manually on this particular test server, so obviously you can’t CREATE it again), and you want to be able to skip it, or mark it as “OK”, or put some comments, or hint that you need assistance from a DBA. You want to be able to quickly add new servers to your deployment group.

Above all, you want every single deployment to be fully audit-able. You want to know exactly who did what and when. If their deployment failed, you want to know that. You want to know why it failed. You want to be able to pick up and try it again, after your DBA found the problem. You want to be able to review yesterday’s deployments, and be able to contact Jane and say “hey, I see you hit a problem here; I know what the problem is; you should do this and that, then please try to deploy again”.

There’s so much more, but I’ll stop telling you what you want to have, since there’s a good manual available. Continue reading » “Introducing Propagator: multi-everything deployment made easy”

Speaking at Percona Live: common_schema, MySQL DevOps

In less than a month I’ll be giving these two talks at Percona Live:

If you are still unfamiliar with common_schema, this will make for a good introduction. I’ll give you multiple reasons why you would want to use it, and how it would come to immediate use at your company. I do mean immediate, as in previous common_schema presentations I happened to get feedback emails from attendees within the same or next day letting me know how common_schema solved an insistent problem of theirs or how it exposed an unknown status.

I’ll review some useful views & routines, and discuss the ease and power of QueryScript. common_schema is a Swiss-knife of solutions, and all from within your MySQL server.

I am using common_schema in production on a regular basis, and it happened to be hero of the day in multiple occasions. I’ll present a couple such cases.

common_schema 2.2: DBA's framework for MySQL (April 2014) from Shlomi Noach

This is a technical talk touching at some cultural issues.

At Outbrain, where I work, we have two blessings: a large group of engineers and a large dataset. We at the infrastructure team, together with the ops team, are responsible for the availability of the data. What we really like is technology which lets the owners of a problem be able to recognize it and take care of it. We want ops guys to do ops, and engineers to do engineering. And we want them to be able to talk to each other and understand each other.

What tools can you use to increase visibility? To allow sharing of data between the teams? I’ll share some tools and techniques that allow us to automate deployments, detect a malfunctioning/abusing service, deploy schema changes across dozens of hosts, control data retention, monitor connections, and more.

We like open source. The tools discussed are mostly open source, or open sourced by Outbrain.

I’ll explain why these tools matter, and how they serve the purpose of removing friction between teams, allowing for quick analysis of problems and overall visibility on all things that happen.

MySQL DevOps at Outbrain from Shlomi Noach

Do come by!

Percona Live – call for “Hall of Shame” talks

We’ve got some spare time on Percona Live during the lightning talks session, and are spontaneously calling for “Hall of Shame” submissions.

What is this about?

We just had a wonderful Reversim Summit a couple weeks back, where we held the “Hall of Shame” session. We are used to hear talks about success stories and great new technologies. Well, this session is your chance to come up and say: “I messed up, and I’m proud of it!”

You will have 3-4 minutes to tell us about how you once accidentally dropped your database; corrupted your data; brought your company’s service down. The greater the damage, the greater the appeal! But we’re looking for the funny edge – not for a tragedy. There are no slides. Just a “Hall of Shame” screen behind you.

The response we got on Reversim Summit? It was amazing. The audience was literally in tears; there were such hilarious stories that we could hardly keep up. People were spontaneously offering their stories and the organizers had to hold them back.

And yet, you will be telling about your mess up – so please make sure you feel OK about this. For what it’s worth, I will contribute my own shameful, shameful story.

So, this is new & experimental for the Percona Live conference, and we don’t have many slots. If no one submits – that’s OK. If too many submit, we’ll have to cut most. As conferences go, we may end up with a last moment open timeslot, so if you’re spontaneous that could be your chance.

Ready to submit?

Please send an email to mysql.hallofshame@gmail.com with a brief description of what you want to share. I’ll be reviewing these submissions and either approve, reject or hold you on a waiting list. I assume this will go by First Come First Served. The deadline for submissions is Friday, Mar 14th.