Revision 76 of mycheckpoint comes with quite a few improvements, including:
- OS monitoring (CPU, load average, memory)
- Auto-deploy
- Improved charting
- Brief HTML reports
- 24/7 charts
OS Monitoring
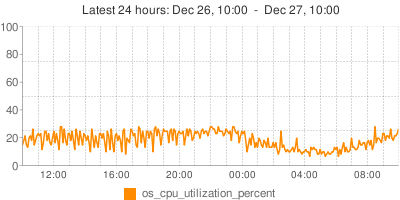
When monitoring the local machine, mycheckpoint now monitors CPU utilization, load average, memory and swap space.
This only applies to the Linux operating system; there is currently no plan to work this out for other operating systems.
Examples:
mysql> SELECT os_cpu_utilization_percent FROM sv_report_chart_sample;
mysql> SELECT ts, os_loadavg FROM mycheckpoint.sv_report_sample;
+---------------------+------------+
| 2009-12-27 11:45:01 |       1.78 |
| 2009-12-27 11:50:01 |       2.48 |
| 2009-12-27 11:55:01 |       2.35 |
...
+---------------------+------------+
mysql> SELECT report FROM mycheckpoint.sv_report_human_sample ORDER BY id DESC LIMIT 1 \G
*************************** 1. row ***************************
report:
Report period: 2009-12-27 13:20:01 to 2009-12-27 13:25:01. Period is 5 minutes (0.08 hours)
Uptime: 100.0% (Up: 334 days, 06:37:28 hours)

OS:
 Load average: 1.67
 CPU utilization: 25.2%
 Memory: 7486.4MB used out of 7985.6484MB (Active: 6685.8906MB)
 Swap: 3835.2MB used out of 8189.3750MB
...
Auto-deploy
mycheckpoint now has a version recognition mechanism. There is no need to call mycheckpoint with the “deploy” argument on first install or after upgrade. mycheckpoint will recognize a change of version and will auto-deploy before moving on to monitoring your system.
It is still possible, though, to use “deploy“, in case you just want to make sure an upgrade takes place, without issuing a monitoring action.
Improved charting
Further improvements and bug fixes made to the Google charts, including the implementation of missing values charting.
Brief HTML report
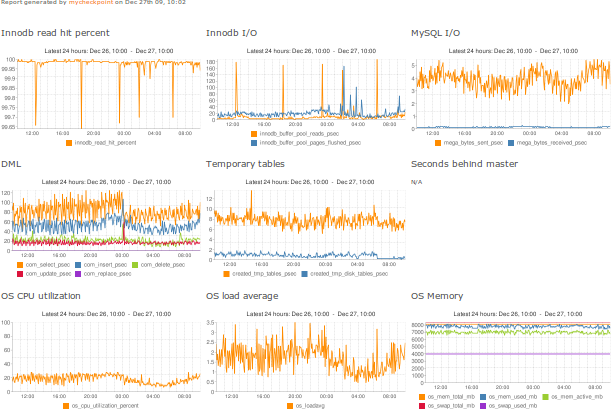
In contrast with the full blown HTML report (see sample), which presents hourly/daily/weekly reports for the many metrics, the new brief report only presents with a few hourly based charts. These include InnoDB performance, DML, OS metrics, and replication status.
To get a brief HTML report, issue:
mysql> SELECT html FROM sv_report_html_brief;
24/7 charts
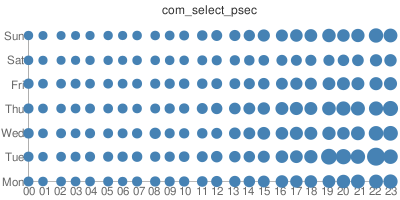
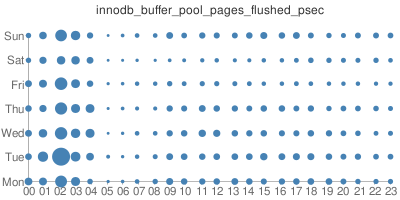
24/7 charts present the various metrics on a 24×7 matrix, which allows for diagnostics of usage throughout the day and week. For example, it makes it easier to see how things slow down on Saturday/Sunday; how load increases on 10:00am every day, etc.
24/7 charts are provided by the sv_report_chart_24_7 view.
DESC sv_report_chart_24_7;
+---------------------------------------+----------+------+-----+---------+-------+
| Field                                 | Type     | Null | Key | Default | Extra |
+---------------------------------------+----------+------+-----+---------+-------+
| innodb_read_hit_percent               | longblob | YES  |     | NULL    |       |
| innodb_buffer_pool_reads_psec         | longblob | YES  |     | NULL    |       |
| innodb_buffer_pool_pages_flushed_psec | longblob | YES  |     | NULL    |       |
| innodb_os_log_written_psec            | longblob | YES  |     | NULL    |       |
| innodb_row_lock_waits_psec            | longblob | YES  |     | NULL    |       |
| mega_bytes_sent_psec                  | longblob | YES  |     | NULL    |       |
| mega_bytes_received_psec              | longblob | YES  |     | NULL    |       |
| key_read_hit_percent                  | longblob | YES  |     | NULL    |       |
| key_write_hit_percent                 | longblob | YES  |     | NULL    |       |
| com_select_psec                       | longblob | YES  |     | NULL    |       |
| com_insert_psec                       | longblob | YES  |     | NULL    |       |
| com_delete_psec                       | longblob | YES  |     | NULL    |       |
| com_update_psec                       | longblob | YES  |     | NULL    |       |
| com_replace_psec                      | longblob | YES  |     | NULL    |       |
| com_set_option_percent                | longblob | YES  |     | NULL    |       |
| com_commit_percent                    | longblob | YES  |     | NULL    |       |
| slow_queries_percent                  | longblob | YES  |     | NULL    |       |
| select_scan_psec                      | longblob | YES  |     | NULL    |       |
| select_full_join_psec                 | longblob | YES  |     | NULL    |       |
| select_range_psec                     | longblob | YES  |     | NULL    |       |
| table_locks_waited_psec               | longblob | YES  |     | NULL    |       |
| opened_tables_psec                    | longblob | YES  |     | NULL    |       |
| created_tmp_tables_psec               | longblob | YES  |     | NULL    |       |
| created_tmp_disk_tables_psec          | longblob | YES  |     | NULL    |       |
| connections_psec                      | longblob | YES  |     | NULL    |       |
| aborted_connects_psec                 | longblob | YES  |     | NULL    |       |
| threads_created_psec                  | longblob | YES  |     | NULL    |       |
| seconds_behind_master                 | longblob | YES  |     | NULL    |       |
| os_loadavg                            | longblob | YES  |     | NULL    |       |
| os_cpu_utilization_percent            | longblob | YES  |     | NULL    |       |
| os_mem_used_mb                        | longblob | YES  |     | NULL    |       |
| os_mem_active_mb                      | longblob | YES  |     | NULL    |       |
| os_swap_used_mb                       | longblob | YES  |     | NULL    |       |
+---------------------------------------+----------+------+-----+---------+-------
Example:
mysql> SELECT com_select_psec, innodb_buffer_pool_pages_flushed_psec FROM mycheckpoint.sv_report_chart_24_7 \G

Trying mycheckpoint
- Get mycheckpoint from the mycheckpoint Google Code project page.
- Read the documentation.
- Report issues!
Future plans
I haven’t got any major immediate issues; planning on user customization of charts and HTML reports. Considering thresholds and alerting for the future.

2 thoughts on “mycheckpoint rev. 76: OS monitoring, auto deploy, brief HTML and 24/7 reports”