I’m experimenting with upgrading to MySQL 5.6 and am experiencing an unexplained increase in disk I/O utilization. After discussing this with several people I’m publishing in the hope that someone has an enlightenment on this.
We have a few dozens servers in a normal replication topology. On this particular replication topology we’ve already evaluated that STATEMENT based replication is faster than ROW based replication, and so we use SBR. We have two different workloads on our slaves, applied by two different HAProxy groups, on three different data centres. Hardware-wise, servers of two groups use either Virident SSD cards or normal SAS spindle disks.
Our servers are I/O bound. A common query used by both workloads looks up data that does not necessarily have a hotspot, and is very large in volume. DML is low, and we only have a few hundred statements per second executed on master (and propagated through replication).
We have upgraded 6 servers from all datacenters to 5.6, both on SSD and spindle disks, and are experiencing the following phenomena:
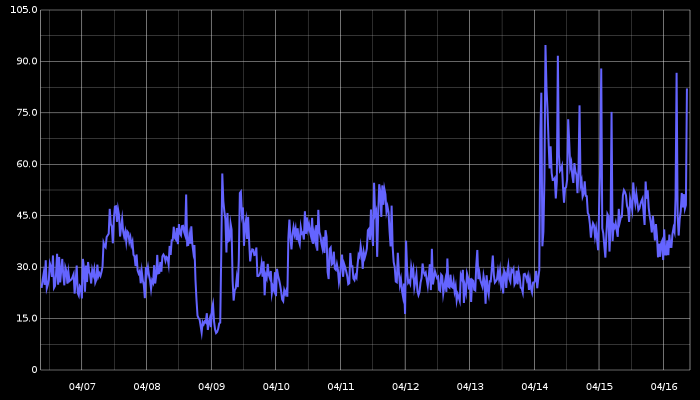
- A substantial increase in disk I/O utilization. See a 10 day breakdown (upgrade is visible on 04/14) this goes on like this many days later:
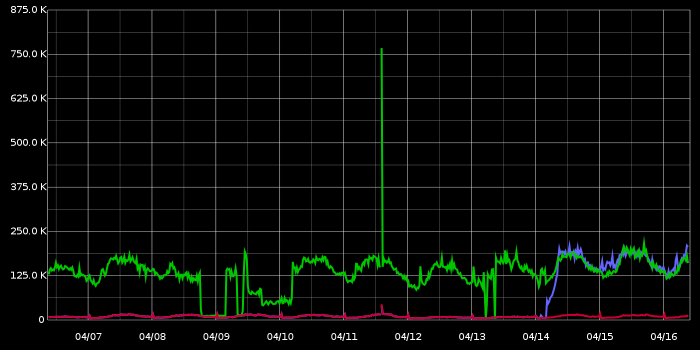
- A substantial increase in InnoDB buffer pool pages flush: Mr. Blue is our newly upgraded server; it joins Mr. Green upgraded a couple weeks ago. Mr. Red is still 5.5. This is the only MySQL graph that I could directly relate to the increase in I/O:
- No change in workload (it takes some 60 minutes for caches to warm up, so measuring after that time). Same equal share of serving as dictated by HAProxy. Same amount of queries. Same amount of everything.
- Faster replication speed, on single thread – that’s the good part! We see 30% and more improvement in replication speed. Tested by stopping SLAVE SQL_THREAD for a number of pre-defined minutes, then measuring time it took for slave to catch up, up to 10 seconds lag. The results vary depending on the time of day and serving workload on slaves, but it is consistently far faster with 5.6.
The faster replication speed motivates us to continue with the experiment, and is of a significant factor in our decision. However we are concerned about the I/O utilization and excessive flushing.
The above graphs depict the 5.6 status without any configuration changes as compared to 5.5. I took some days to reconfigure the following variables, with no change to the rate of flushed pages (though some changes visible in double-wite buffer writes):
- innodb_log_file_size=128M/2G
- innodb_adaptive_flushing:=0/1
- innodb_adaptive_flushing_lwm:=0/70
- innodb_max_dirty_pages_pct := 75/90
- innodb_flush_neighbors:=0/1
- innodb_max_dirty_pages_pct_lwm:=75/90
- innodb_old_blocks_time:=0/1000
- innodb_io_capacity:=50/100/200
- innodb_io_capacity_max:=50/100/1000
- relay_log_info_repository:=’table’/’file’
- master_info_repository:=’table’/’file’
- default_tmp_storage_engine:=’myisam’/’innodb’
- eq_range_index_dive_limit:=0/10
And more… Have done patient one-by-one or combinations of the above where it made sense. As you see I began with the usual suspects and moved on to more esoteric stuff. I concentrated on new variables introduced in 5.6, or ones where the defaults have changed, or ones we have explicitly changed the defaults from.
The above is consistent on all upgraded servers. On SSD the disk utilization is lower, but still concerning.
Our use case is very different from the one presented by Yoshinori Matsunobu. and apparently not too many have experienced upgrading to 5.6. I’m hoping someone might shed some light.
It isn’t on the list, but did you try to tweak innodb_io_capacity in combination with innodb_lru_scan_depth?
The page cleaner might be too zealous for your workload and decreasing innodb_lru_scan_depth might help.
Hello justin,
Thank you for sharing buffer pool flushing issue.
Even we have experienced few challenges in the past after upgraded from 5.5 to 5.6.
1.After upgrade CPU usage reaching upto 1000% (24 core and 64 GB RAM).Normally it’s reach upto 150% max in peak hours.Checked processlist One complex query with join causing a problem,after query optimization it got resolved.
2.Geographical data replication(GTID enabled) our slave database was lagging. The value of Seconds_Behind_Master was jumping from 0 to a random high value, and then back to 0.
It got fixed by setting
set global slave_compressed_protocol=1;
SET GLOBAL slave_net_timeout=60;
Now we are facing memory leak issue(mysql 5.6.15),mysqld process memory keep increasing.we have to restart mysql service to release it.
@Justin,
Double checked. With:
and
(100 being the minimal allowed value for lru scan depth)
— there is no change at all in flushing rate.
Do you leave innodb_buffer_pool_instances at default? In the case you do, you have 1 instance in 5.5 and 8 instances in 5.6. More instances cause more flushing.
If the number of instances is the same or cannot explain the difference by itself alone, then it is interesting that tuning innodb_log_file_size, innodb_adaptive_flushing*, and innodb_io_capacity_* did not have an effect on flushing rate. This sort of suggests that it is LRU flushing that is going on. Can you check whether it is LRU or flush list flushing?
In case it is LRU flushing, you will need to tune innodb_max_lru_scan_depth, but then again, it has a rather low default, and increasing it is likely to result in even more flushing.
In case it is flush list flushing, how does checkpoint age compare in 5.5 and 5.6?
We also found in developing XtraDB 5.6 that 5.6 flushed more than 5.5, which we addressed by tuning the AF formula – but that too-aggressive flushing only became visible after several other flushing performance fixes we implemented. Would be interesting to see how much does XtraDB flush in your setup.
@Laurnyas,
innodb_buffer_pool_instances=8/22, excplicitly set (with 5.5 it was 8; when upgraded left as 8, later changed to 22; same flushign in both cases)