Orchestrator 1.0.5: refactoring masters, multi-master replication

Outbrain’s orchestrator Version 1.0.5 is released.

Quick links: Orchestrator Manual, FAQ, Downloads

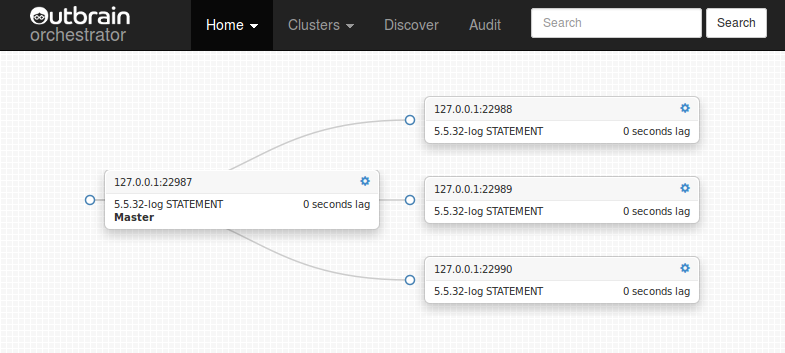
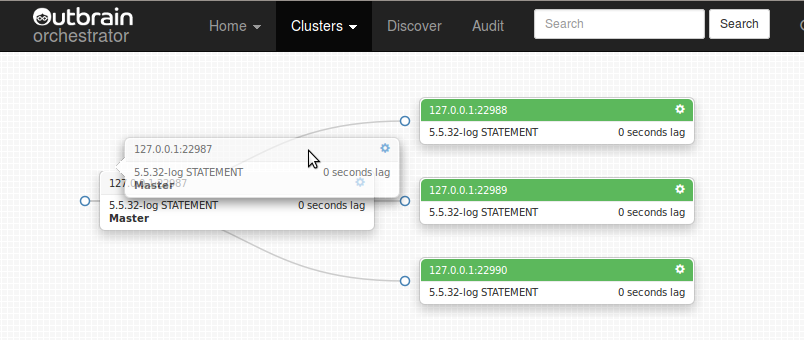
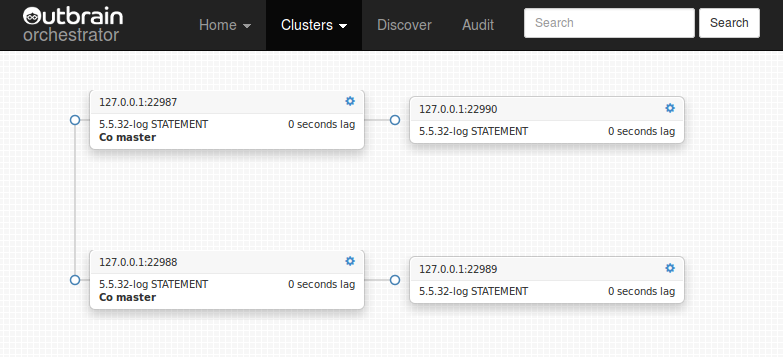
Orchestrator now supports refactoring of masters via master-master topologies. It now allows promoting slaves as co-masters and detachment of instances from a co-master topology, effectively allowing for replacing an active master.

Like this

Drag a master:

orchestator-cm-simple-drag-master-01

Onto one of its slaves: Continue reading » “Orchestrator 1.0.5: refactoring masters, multi-master replication”

Introducing Orchestrator: manage and visualize your MySQL replication topologies and get home for dinner

I’m happy to announce the availability of Outbrain‘s Orchestrator: MySQL replication management & visualization tool.

orchestrator - simple topology

  • Orchestrator reads your replication topologies (give it one server – be it master or slave – in each topology, and it will reveal the rest).
  • It keeps a state of this topology.
  • It can continuously poll your servers to get an up to date topology map.
  • It visualizes the topology in a clear and slick D3 tree.
  • It allows you to modify your topology; move slaves around. You can use the command line variation, the JSON API, or you can use the web interface.

Quick links: Orchestrator Manual, FAQ, Downloads

Nothing like nice screenshots

To move slaves around the topology (repoint a slave to a different master) through orchestrator‘s web interface, we use Drag and Drop, Continue reading » “Introducing Orchestrator: manage and visualize your MySQL replication topologies and get home for dinner”

“Anemomaster”: DML visibility. Your must-do for tomorrow

Here’s our take of master DML query monitoring at Outbrain (presented April 2014). It took a half-day to code, implement, automate and deploy, and within the first hour of work we managed to catch multiple ill-doing services and scripts. You might want to try this out for yourself.

What’s this about?

What queries do you monitor on your MySQL servers? Many don’t monitor queries at all, and only look up slow queries on occasion, using pt-query-digest. Some monitor slow queries, where Anemometer (relying on pt-query-digest) is a very good tool. To the extreme, some monitor TCP traffic on all MySQL servers — good for you! In between, there’s a particular type of queries that are of special interest: DML (INSERT/UPDATE/DELETE) queries issued against the master.

They are of particular interest because they are only issued once against the master, yet propagate through replication topology to execute on all slaves. These queries have a direct impact on your slave lag and on your overall replication capacity. I suggest you should be familiar with your DMLs just as you are with your slow queries.

In particular, we had multiple occasions in the past where all or most slaves started lagging. Frantically we would go to our metrics; yes! We would see a spike in com_insert. Someone (some service) was obviously generating more INSERTs than usual, at a high rate that the slaves could not keep up with. But, which INSERT was that? Blindly, we would look at the binary logs. Well, erm, what are we looking for, exactly?

Two such occasions convinced us that there should be a solution, but it took some time till it hit us. We were already using Anemometer for monitoring our slow logs. We can do the same for monitoring our binary logs. Thus was born “Anemomaster”.

Quick recap on how Anemometer works: you issue pt-query-digest on your slow logs on all MySQL hosts (we actually first ship the slow logs to a central place where we analyse them; same thing). This is done periodically, and slow logs are then rotated. You throw the output of pt-query-digest to a central database (this is built in with pt-query-digest; it doesn’t necessarily produce human readable reports). Anemometer would read this central database and visualize the slow queries.

Analysing DMLs

But then, pt-query-digest doesn’t only parse slow logs. It can parse binary logs. Instead of asking for total query time, we ask for query count, and on we go to establish the same mechanism, using same pt-query-digest and same Anemometer to store and visualize the DMLs issued on our masters.

When analysing DMLs we’re interested in parsing binary logs — and it makes no sense to do the same on all slaves. All slaves just have same copy of binlog entries as the master produces. It only takes one server to get an accurate picture of the DMLs on your replication topology.

Continue reading » ““Anemomaster”: DML visibility. Your must-do for tomorrow”

Speaking at Percona Live: common_schema, MySQL DevOps

In less than a month I’ll be giving these two talks at Percona Live:

If you are still unfamiliar with common_schema, this will make for a good introduction. I’ll give you multiple reasons why you would want to use it, and how it would come to immediate use at your company. I do mean immediate, as in previous common_schema presentations I happened to get feedback emails from attendees within the same or next day letting me know how common_schema solved an insistent problem of theirs or how it exposed an unknown status.

I’ll review some useful views & routines, and discuss the ease and power of QueryScript. common_schema is a Swiss-knife of solutions, and all from within your MySQL server.

I am using common_schema in production on a regular basis, and it happened to be hero of the day in multiple occasions. I’ll present a couple such cases.

common_schema 2.2: DBA's framework for MySQL (April 2014) from Shlomi Noach

This is a technical talk touching at some cultural issues.

At Outbrain, where I work, we have two blessings: a large group of engineers and a large dataset. We at the infrastructure team, together with the ops team, are responsible for the availability of the data. What we really like is technology which lets the owners of a problem be able to recognize it and take care of it. We want ops guys to do ops, and engineers to do engineering. And we want them to be able to talk to each other and understand each other.

What tools can you use to increase visibility? To allow sharing of data between the teams? I’ll share some tools and techniques that allow us to automate deployments, detect a malfunctioning/abusing service, deploy schema changes across dozens of hosts, control data retention, monitor connections, and more.

We like open source. The tools discussed are mostly open source, or open sourced by Outbrain.

I’ll explain why these tools matter, and how they serve the purpose of removing friction between teams, allowing for quick analysis of problems and overall visibility on all things that happen.

MySQL DevOps at Outbrain from Shlomi Noach

Do come by!

Introducing audit_login: simple MySQL login logfile based auditing

audit_login is a simple MySQL login auditing plugin, logging any login or login attempt to log file in JSON format.

It seems that audit plugins are all the rage lately… We’ve developed out simple plugin a month ago as part of our database securing efforts; by auditing any login or login attempt we could either intercept or later investigate suspicious logins.

However we quickly realized there is much more to be gathered by this info.

In very short, you install this plugin onto your MySQL server, and your server starts writing into a text file called audit_login.log entries such as follows:

{"ts":"2013-09-11 09:11:47","type":"successful_login","myhost":"gromit03","thread":"74153868","user":"web_user","priv_user":"web_user","host":"web-87.localdomain","ip":"10.0.0.87"}
{"ts":"2013-09-11 09:11:55","type":"failed_login","myhost":"gromit03","thread":"74153869","user":"backup_user","priv_user":"","host":"web-32","ip":"10.0.0.32"}
{"ts":"2013-09-11 09:11:57","type":"failed_login","myhost":"gromit03","thread":"74153870","user":"backup_user","priv_user":"","host":"web-32","ip":"10.0.0.32"}
{"ts":"2013-09-11 09:12:48","type":"successful_login","myhost":"gromit03","thread":"74153871","user":"root","priv_user":"root","host":"localhost","ip":"10.0.0.111"}
{"ts":"2013-09-11 09:13:26","type":"successful_login","myhost":"gromit03","thread":"74153872","user":"web_user","priv_user":"web_user","host":"web-11.localdomain","ip":"10.0.0.11"}
{"ts":"2013-09-11 09:13:44","type":"successful_login","myhost":"gromit03","thread":"74153873","user":"web_user","priv_user":"web_user","host":"web-40.localdomain","ip":"10.0.0.40"}
{"ts":"2013-09-11 09:13:51","type":"successful_login","myhost":"gromit03","thread":"74153874","user":"web_user","priv_user":"web_user","host":"web-03.localdomain","ip":"10.0.0.03"}
{"ts":"2013-09-11 09:14:09","type":"successful_login","myhost":"gromit03","thread":"74153875","user":"web_user","priv_user":"web_user","host":"web-40.localdomain","ip":"10.0.0.40"}
{"ts":"2013-09-11 10:55:25","type":"successful_login","myhost":"gromit03","thread":"74153876","user":"web_user","priv_user":"web_user","host":"web-87.localdomain","ip":"10.0.0.87"}
{"ts":"2013-09-11 10:55:59","type":"successful_login","myhost":"gromit03","thread":"74153877","user":"web_user","priv_user":"web_user","host":"web-12.localdomain","ip":"10.0.0.12"}
{"ts":"2013-09-11 10:55:59","type":"failed_login","myhost":"gromit03","thread":"74153878","user":"(null)","priv_user":"(null)","host":"(null)","ip":"10.0.0.1"}

In the above your MySQL server is on gromit03, and is accepting connections from other hosts; some successful, some not. What kind of information can you gather from the above?

  • You can tell how many connections are being created on your server
  • Where they came from
  • Where ‘root’ connections come from
  • Port scans (see last row) can be identified by no credentials. These don’t have to be port scans per se; any telnet localhost 3006 followed by Ctrl+D will show the same. Typically these would be either load balancer or monitoring tools checks to see that the 3306 port is active.
  • You can tell which accounts connect, and how many times
  • And you can infer which accounts are stale and can be dropped — if an account does not connect within a week’s time, it’s probably stale (pick your own timeframe)

The above is quite interesting on one host; but we have dozens. We’ve installed this plugin on all our MySQL servers, and we use logstash to aggregate them. We aggregate to two destinations: Continue reading » “Introducing audit_login: simple MySQL login logfile based auditing”
Converting an OLAP database to TokuDB, part 1

This is the first in a series of posts describing my impressions of converting a large OLAP server to TokuDB. There’s a lot to tell, and the experiment is not yet complete, so this is an ongoing blogging. In this post I will describe the case at hand and out initial reasons for looking at TokuDB.

Disclosure: I have no personal interests and no company interests; we did get friendly, useful and free advice from Tokutek engineers. TokuDB is open source and free to use, though commercial license is also available.

The case at hand

We have a large and fast growing DWH MySQL setup. This data warehouse is but one component in a larger data setup, which includes Hadoop, Cassandra and more. For online dashboards and most reports, MySQL is our service. We populate this warehouse mainly via Hive/Hadoop. Thus, we have an hourly load of data from Hive, as well as a larger daily load.

There are some updates on the data, but the majority of writes are just mysqlimports of Hive queries.

Usage of this database is OLAP: no concurrency issues here; we have some should-be-fast-running queries issued by our dashboards, as well as ok-to-run-longer queries issued for reports.

Our initial and most burning trouble is with size. Today we use COMPRESSED InnoDB tables (KEY_BLOCK_SIZE is default, i.e. 8). Our data volume sums right now at about 2TB. I happen to know this translates as 4TB of uncompressed data.

However growth of data is accelerating. A year ago we would capture a dozen GB per month. Today it is a 100GB per month, and by the end of this year it may climb to 150GB per month or more.

Our data is not sharded. We have a simple replication topology of some 6 servers. Machines are quite generous as detailed following. And yet, we will be running out of resources shortly: disk space (total 2.7TB) is now running low and is expected to run out in about six months. One of my first tasks in Outbrain is to find a solution to our DWH growth problem. The solution could be sharding; it could be a commercial DWH product; anything that works. Continue reading » “Converting an OLAP database to TokuDB, part 1”

common_schema 2.2: better QueryScript isolation & cleanup; TokuDB; table_rotate, split params

common_schema 2.2 is released. This is shortly after the 2.1 release; it was only meant as bug fixes release but some interesting things came up, leading to new functionality.

Highlights of the 2.2 release:

  • Better QueryScript isolation & cleanup: isolation improved across replication topology, cleanup done even on error
  • Added TokuDB related views
  • split with “index” hint (Ike, this is for you)
  • table_rotate(): a logrotate-like mechanism for tables
  • better throw()

Drill down:

Better QueryScript isolation & cleanup

common_schema 2.1 introduced persistent tables for QueryScript. This also introduced the problem of isolating concurrent scripts, all reading from and writing to shared tables. In 2.1 isolation was based on session id. However although unique per machine, collisions were possible across replication topology: a script could be issued on master, another on slave (I have such use cases) and both use same (local) session id.

With 2.2 isolation is based on server_id & session id combination; this is unique across a replication topology.

Until 2.1, QueryScript used temporary tables. This meant any error would just break the script, and the tables were left (isolated as they were, and auto-destroyed in time). With persistent tables a script throwing an error meant legacy code piling up. With common_schema 2.2 and on MySQL >= 5.5 all exceptions are caught, cleanup is made, leaving exceptions to be RESIGNALled.

TokuDB views

A couple TokuDB related views help out in converting to TokuDB and in figuring out tables status on disk: Continue reading » “common_schema 2.2: better QueryScript isolation & cleanup; TokuDB; table_rotate, split params”

Tool of the day: q

If you work with command line and know your SQL, q is a great tool to use:

q allows you to query your text files or standard input with SQL. You can:

SELECT c1, COUNT(*) FROM /home/shlomi/tmp/my_file.csv GROUP BY c1

And you can:

SELECT all.c2 FROM /tmp/all_engines.txt AS all LEFT JOIN /tmp/innodb_engines.txt AS inno USING (c1, c2) WHERE inno.c3 IS NULL

And you can also combine with your favourite shell commands and tools:

grep "my_term" /tmp/my_file.txt | q "SELECT c4 FROM - JOIN /home/shlomi/static.txt USING (c1)" | xargs touch

Some of q‘s functionality (and indeed, SQL functionality) can be found in command line tools. You can use grep for pseudo WHERE filtering, or cut for projecting, but you can only get so far with cat my_file.csv | sort | uniq -c | sort -n. SQL is way more powerful for working with tabulated data, and so q makes for a great addition into one’s toolbox.

The tool is authored by my colleague Harel Ben-Attia, and is in daily use over at our company (it is in fact installed on all production servers).

It is of course free and open source (get it on GitHub, where you can also find documentation), and very easy to setup. Enjoy!

common_schema roadmap thoughts

I’m happy with common_schema; it is in fact a tool I use myself on an almost daily basis. I’m also happy to see that it gains traction; which is why I’m exposing a little bit of my thoughts on general future development. I’d love to get feedback.

Supported versions

At this moment, common_schema supports MySQL >= 5.1, all variants. This includes 5.5, 5.6, MySQL, Percona Server & MariaDB.

5.1 is today past end of line, and I’m really missing the SIGNAL/RESIGNAL syntax that I would like to use; I can do in the meanwhile with version-specific code such as /*!50500 … */. Nevertheless, I’m wondering whether I will eventually have to:

  • Support different branches of common_schema (one that supports 5.1, one that supports >= 5.5)
  • Stop support for 5.1

Of course community-wise, the former is preferred; but I have limited resources, so I would like to make a quick poll here:

[poll id=”3″]

I’ll use the poll’s results as a vague idea of what people use and want. Or please use comments below to sound your voice!

rdebug

This was a crazy jump at providing a stored routine debugger and debugging API. From some talk I made I don’t see this getting traction. For the time being, I don’t see that I will concentrate my efforts on this. Actually it is almost complete. You can step-into, step-out, step-over, set breakpoints, read variables, modify variables — it’s pretty cool. Continue reading » “common_schema roadmap thoughts”