I’m experimenting with upgrading to MySQL 5.6 and am experiencing an unexplained increase in disk I/O utilization. After discussing this with several people I’m publishing in the hope that someone has an enlightenment on this.
We have a few dozens servers in a normal replication topology. On this particular replication topology we’ve already evaluated that STATEMENT based replication is faster than ROW based replication, and so we use SBR. We have two different workloads on our slaves, applied by two different HAProxy groups, on three different data centres. Hardware-wise, servers of two groups use either Virident SSD cards or normal SAS spindle disks.
Our servers are I/O bound. A common query used by both workloads looks up data that does not necessarily have a hotspot, and is very large in volume. DML is low, and we only have a few hundred statements per second executed on master (and propagated through replication).
We have upgraded 6 servers from all datacenters to 5.6, both on SSD and spindle disks, and are experiencing the following phenomena:
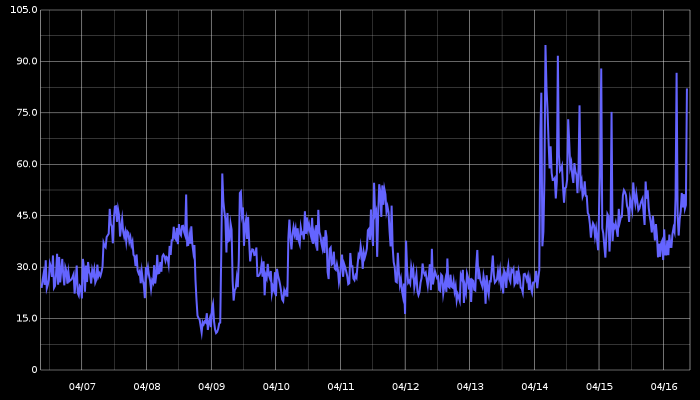
- A substantial increase in disk I/O utilization. See a 10 day breakdown (upgrade is visible on 04/14) this goes on like this many days later:
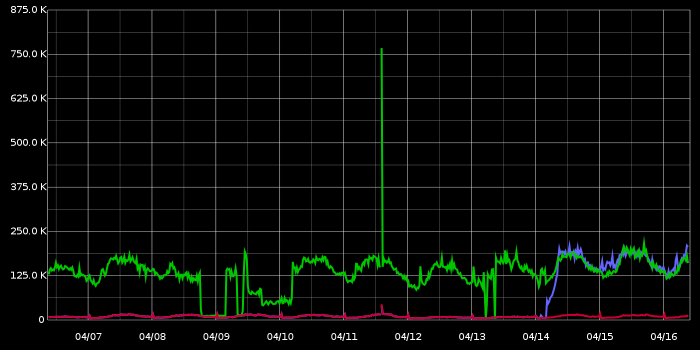
- A substantial increase in InnoDB buffer pool pages flush: Mr. Blue is our newly upgraded server; it joins Mr. Green upgraded a couple weeks ago. Mr. Red is still 5.5. This is the only MySQL graph that I could directly relate to the increase in I/O:
- No change in workload (it takes some 60 minutes for caches to warm up, so measuring after that time). Same equal share of serving as dictated by HAProxy. Same amount of queries. Same amount of everything.
- Faster replication speed, on single thread – that’s the good part! We see 30% and more improvement in replication speed. Tested by stopping SLAVE SQL_THREAD for a number of pre-defined minutes, then measuring time it took for slave to catch up, up to 10 seconds lag. The results vary depending on the time of day and serving workload on slaves, but it is consistently far faster with 5.6.
The faster replication speed motivates us to continue with the experiment, and is of a significant factor in our decision. However we are concerned about the I/O utilization and excessive flushing.
The above graphs depict the 5.6 status without any configuration changes as compared to 5.5. I took some days to reconfigure the following variables, with no change to the rate of flushed pages (though some changes visible in double-wite buffer writes):
- innodb_log_file_size=128M/2G
- innodb_adaptive_flushing:=0/1
- innodb_adaptive_flushing_lwm:=0/70
- innodb_max_dirty_pages_pct := 75/90
- innodb_flush_neighbors:=0/1
- innodb_max_dirty_pages_pct_lwm:=75/90
- innodb_old_blocks_time:=0/1000
- innodb_io_capacity:=50/100/200
- innodb_io_capacity_max:=50/100/1000
- relay_log_info_repository:=’table’/’file’
- master_info_repository:=’table’/’file’
- default_tmp_storage_engine:=’myisam’/’innodb’
- eq_range_index_dive_limit:=0/10
And more… Have done patient one-by-one or combinations of the above where it made sense. As you see I began with the usual suspects and moved on to more esoteric stuff. I concentrated on new variables introduced in 5.6, or ones where the defaults have changed, or ones we have explicitly changed the defaults from.
The above is consistent on all upgraded servers. On SSD the disk utilization is lower, but still concerning.
Our use case is very different from the one presented by Yoshinori Matsunobu. and apparently not too many have experienced upgrading to 5.6. I’m hoping someone might shed some light.


Correction on my post : I meant to say “If the flushing algorithm has to look for contiguous dirty pages only, there should be no reason for excessive flushing.”
@Rolando, as per my comment #9, my submitted bug report turns into “valid behaviour”. I am still without solution for excessive flushing.
We have upgraded one of our MySQL servers from Percona MySQL 5.5 to Percona MySQL 5.6, while at the same time we have upgraded another server from plain 5.5. to 5.6. After the upgrade, without any changes in the application code, both servers experience constant spikes in flushing activity, well beyond the innodb_io_capaicty_max setting. In the last 20 hours I’ve tried any combination of the same parameters described by Shlomi in his post + some more:
innodb_flush_method = O_DIRECT / O_DIRECT_NO_FSYNC (actually this helped a bit – same IOPS spikes, but causing only 1/3 of the max disk latency
innodb_lru_scan_depth = 1024 / 2048 / 4096
innodb_flushing_avg_loops = 10 / 20 / 30 / 40 / 50 / 60
I will continue to investigate, but what makes feel weird is that the adaptive flushing never really kicks in, until is too late and then buffer_flush_background_total_pages shows rapid increase and all 50K dirty pages are being flushed at a rate approx. 3 x innodb_io_capacity_max…