mycheckpoint (rev 208): aggregation tables, enhanced charting, RPM distribution

Revision 208 of mycheckpoint, a MySQL monitoring solution, has been released. New and updated in this revision:

  • Aggregation tables: aggregated data makes for fast reports on previously slow queries.
  • Enhanced charting: interactive charts now present time stamps dynamically (see demo); “Zoom in” charts are available (see demo) on mycheckpoint‘s HTTP server.
  • RPM distribution: a “noarch” RPM mycheckpoint build is now available.
  • Initial work on formalizing test environment

mycheckpoint celebrates one year of existence!

Aggregation tables

I really wanted to avoid using these: everything was so more beautiful with one single dataset and dozens of supporting views (OK, the views themselves are hardly “beautiful”).

However it was impossible (for my level of expertise) to optimize query performance what with all those views on per-hour and per-day aggregation. The GROUP BYs and the JOINs did not make it possible for condition pushdown (i.e. using MERGE algorithm) where desired.

As result, mycheckpoint now manages aggregation tables: per-hour and per-day. The impact on sample taking is neglect able (making for two additional fast queries), but the impact on reading aggregated data is overwhelming. Generating a HTML full report could take a few minutes to complete. It now returns in no time. This makes charting more attractive, and allows for enhanced charting, such as zooming in on charts, as described following.

Aggregation tables will automatically be created and retroactively populated upon using revision 208. There’s nothing special to do; be advised that for one single execution of mycheckpoint, many INSERT queries are going to be executed. Shouldn’t take more than a couple minutes on commodity hardware and a few months of history.

It is possible to disable aggregation tables, or make for a complete rebuild of tables; by default, though, aggregation is ON.

Enhanced charting

Two enhancements here: Continue reading » “mycheckpoint (rev 208): aggregation tables, enhanced charting, RPM distribution”
mycheckpoint (rev. 190): HTTP server; interactive charts

Revision 190 of mycheckpoint, a MySQL monitoring solution, has been released. New and updated in this revision:

  • HTTP server: mycheckpoint can now act as a web server. Point your browser and start browsing through HTML reports. See mock up demo.
  • Interactive charts: HTML line charts are now interactive, presenting with accurate data as you move over them. See sample.
  • Enhanced auto-deploy: now auto-recognizing failed upgrades.
  • Reduced footprint: much code taken out of the views, leading to faster loading times.
  • Better configuration file use: now supporting all command line options in config file.
  • Remote host monitoring accessibility: now supporting complete configurable accessibility details.
  • Bug fixes: thanks to the bug reporters!

mycheckpoint is free, simple, easy to use (now easier with HTTP server) and useful. I encourage you to try it out: even compared with other existing and emerging monitoring tools, I believe you will find it a breeze; it’s low impact and lightness appealing; it’s alerts mechanism assuring; its geeky SQL-based nature with ability to drill down to fine details — geeky-kind-of-attractive.

</encouragement>

HTTP server

You can now run mycheckpoint in http mode:

bash$ mycheckpoint http

mycheckpoint will listen on port 12306, and will present you with easy browsing through the reports of your mycheckpoint databases. Continue reading » “mycheckpoint (rev. 190): HTTP server; interactive charts”

mycheckpoint (rev. 170): improved custom queries; local charting; page/swap I/O monitoring; improved HTML reports

Revision 170 of mycheckpoint, a MySQL monitoring solution, has been released. New and updated in this revision:

  • Improved custom queries: lifting of limitations from previous, introductory revision; better HTML presentation
  • Local, inline charting: no rendering of Google Charts, unless explicitly requested. All charts are now rendered locally using JavaScript. No data is now sent over the network.
  • Page/Swap I/O monitoring: now monitoring for page ins and outs, swap ins and outs (Linux only).
  • Improved HTML reports: several improvements on presentation (see sample, more follow).

Improved custom queries

Some limitations, introduced in revision 132, are now lifted. New features are introduced.

  • There is now no limit to the number of custom queries (well, an INT limit).
  • In fact, the data tables adjust themselves to the existing custom queries in the form of auto-deploy: once a new custom query is added or an old one removed, mycheckpoint will add or remove the relevant columns from the data tables.
  • The chart_order column is now utilized: HTML reports which include custom query charts now order those charts according to chart_order values. This makes for nicer reports.
  • The standard HTML brief report (SELECT html FROM sv_report_html_brief) now automatically includes all custom charts. The HTML brief report is the report one usually wants to look at: it provides with the latest 24 hours metrics for selected values. It now becomes a centralized place for all that is interesting in the past 24 hours.
  • Custom queries are now allowed to return NULL, treated as a missing value. This is a bugfix from previous revisions.

Local charting

Motivation for local charting is clear: no one likes having their data being sent over the network. And no one likes Google to know about their DML values.

I’ve been playing around with quite a few charting solutions, and have gone into depths with two of them, adding and rewriting quite a lot of code. Eventually, I settled on my very own rendering. Here’s what I’ve seen & tested: Continue reading » “mycheckpoint (rev. 170): improved custom queries; local charting; page/swap I/O monitoring; improved HTML reports”

mycheckpoint (rev. 132): custom monitoring, custom charts, process list dump

Revision 132 of mycheckpoint has been released. New and updated in this revision:

  • Custom monitoring: monitoring & charting for user defined queries
  • HTML reports for custom monitoring
  • Process list dump upon alert notifications

Custom monitoring & charts

Custom monitoring allows the user to supply with a query, the results of which will be monitored.

That is, mycheckpoint monitors the status variables, replication status, OS metrics. But it cannot by itself monitor one’s application. Which is why a user may supply with such query as:

SELECT COUNT(*) FROM shopping_cart WHERE is_pending=1

Such a query will tell an online store how many customers are in the midst of shopping. There is no argument that this number is worth monitoring for. Given the above query, mycheckpoint will execute it per sample, and store the query’s result along with all sampled data, to be then aggregated by complex views to answer for:

  • What was the value per given sample?
  • What is the value difference for each sample?
  • What is the change per second, i.e. the rate?

mycheckpoint goes one step forward, and explicity records another metric:

  • How much time did it take to take that sample?

Continue reading » “mycheckpoint (rev. 132): custom monitoring, custom charts, process list dump”

mycheckpoint (Rev. 118): alerts, email notifications and more

Revision 118 of mycheckpoint has been released. New and updated in this revision:

  • Conditional alerts
  • Email notifications
  • Revised HTML reports, including 24/7 reports.
  • Updated documentation

With this new revision mycheckpoint turns into a monitoring solution for MySQL. One can now:

  • Store measure metrics
  • Query for raw, aggregated or digested metrics
  • Generate charts for selected metrics
  • View HTML reports for selecetd metrics
  • Define alerts conditions, query for pending alerts
  • Be notified via email on raised or resolved alerts.

Conditional alerts

mycheckpoint is SQL oriented. As such, it allows for creation of alert conditions, which are nothing more than SQL conditions.

Continue reading » “mycheckpoint (Rev. 118): alerts, email notifications and more”

Things to monitor on MySQL, the user’s perspective

Working on mycheckpoint, I have the intention of adding custom monitoring. That is, letting the user define things to monitor. I have my own thoughts, I would be grateful to get more input!

What would the user want to monitor?

Monitoring for the number of SELECT statements per second, InnoDB locks, slave replication lag etc. is very important, and monitoring utilities provide with this information. But what does that tell the end user? Not much.

The experienced DBA may gain a lot. The user would be more interested in completely other kind of information. In between, some information is relevant to both.

Say we were managing an on-line store. We want to monitor the health of the database. But the health of the database is inseparable from the health of the application. I mean, having little to no disk usage is fine, unless… something is wrong with the application, which leads to no new purchases.

And so a user would be interested in monitoring the number of purchases per hour, or the time passed since last successful purchase. This kind of data can only be generated by a user’s specific query. Looking at the charts, the user would then feel safer and confident in the wellness of his store app.

Continue reading » “Things to monitor on MySQL, the user’s perspective”

Static charts vs. interactive charts

I’m having my usual fun with charts. Working on mycheckpoint, I’ve generated monitoring charts using the Google Chars API. But I’ve also had chance to experiment and deploy interactive charts, JavaScript based. In particular, I used and tweaked dygraphs.

I’d like to note some differences in using charts of both kinds. And I think it makes a very big difference.

Static charts

I’ll call any image-based chart by “static chart”. It’s just a static image. Example of such charts are those generated by Google Image Charts (they now also have new, interactive charts), or RRDtool. Show below is an example of a static chart; in this example, generated by Google: Continue reading » “Static charts vs. interactive charts”

mycheckpoint (rev. 88): mount points monitoring, improved charting, enhanced auto-deploy

Revision #88 of mycheckpoint is released. In this revision:

  • Disk space monitoring
  • Improved charting
  • Enhanced auto-deploy
  • And more…

Disk space monitoring

mycheckpoint now monitors (on Linux only) three mount points:

  1. The “/” (root) mount point
  2. The datadir mount point
  3. The tmpdir mount point

It may well be the case that two of the above (or perhaps all three of them) share the same mount point. For example, if there isn’t any particular partition for “/tmp“, it is possible that the tmpdir (by default “/tmp“) is on the same mount point as “/“. mycheckpoint does not care.

mycheckpoint monitors and reports the mount point’s used percent, in a similar algorithm df uses.

Disk space monitoring is only possible when monitoring the local machine (i.e. mycheckpoint runs on the same machine as the monitored MySQL server). In the future mycheckpoint may also monitor additional mount points, such as the various logs mount points.

Continue reading » “mycheckpoint (rev. 88): mount points monitoring, improved charting, enhanced auto-deploy”

mycheckpoint rev. 76: OS monitoring, auto deploy, brief HTML and 24/7 reports

Revision 76 of mycheckpoint comes with quite a few improvements, including:

  • OS monitoring (CPU, load average, memory)
  • Auto-deploy
  • Improved charting
  • Brief HTML reports
  • 24/7 charts

OS Monitoring

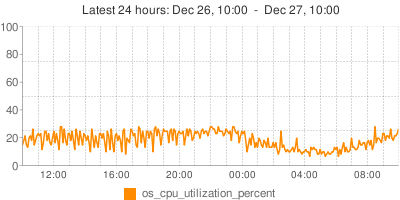
When monitoring the local machine, mycheckpoint now monitors CPU utilization, load average, memory and swap space.

This only applies to the Linux operating system; there is currently no plan to work this out for other operating systems.

Examples:

mysql> SELECT os_cpu_utilization_percent FROM sv_report_chart_sample;

mycheckpoint-chart-cpu-sample
mysql> SELECT ts, os_loadavg FROM mycheckpoint.sv_report_sample;
+---------------------+------------+
| 2009-12-27 11:45:01 |       1.78 |
| 2009-12-27 11:50:01 |       2.48 |
| 2009-12-27 11:55:01 |       2.35 |
...
+---------------------+------------+
mysql> SELECT report FROM mycheckpoint.sv_report_human_sample ORDER BY id DESC LIMIT 1 \G
*************************** 1. row ***************************
report:
Report period: 2009-12-27 13:20:01 to 2009-12-27 13:25:01. Period is 5 minutes (0.08 hours)
Uptime: 100.0% (Up: 334 days, 06:37:28 hours)

OS:
 Load average: 1.67
 CPU utilization: 25.2%
 Memory: 7486.4MB used out of 7985.6484MB (Active: 6685.8906MB)
 Swap: 3835.2MB used out of 8189.3750MB
...

Auto-deploy

mycheckpoint now has a version recognition mechanism. There is no need to call mycheckpoint with the “deploy” argument on first install or after upgrade. mycheckpoint will recognize a change of version and will auto-deploy before moving on to monitoring your system.

Continue reading » “mycheckpoint rev. 76: OS monitoring, auto deploy, brief HTML and 24/7 reports”

New and noteworthy in mycheckpoint (rev. 57)

Rev. 57 of mycheckpoint has been released and is available for download.

New and updated in this revision:

Remote host monitoring

It is now possible to monitor one host, while writing into another. Either or both could be remote hosts:

mycheckpoint --host=localhost --monitored-host=192.168.10.178

The above monitors the MySQL server on 192.168.10.178, and writes down to localhost (to be queried later)

mycheckpoint --monitored-host=127.0.0.1 --host=192.168.10.178

The above monitors the MySQL server on 127.0.0.1, and writes down to 192.168.10.178.

Continue reading » “New and noteworthy in mycheckpoint (rev. 57)”